![[ad] Empower free webinar 9 September](https://fundraising.co.uk/wp-content/uploads/2026/07/Banner-Ad-728x90-1-1.png.webp)
6 digital annual reports to support fundraising

Howard Lake | 26 October 2016 | Blogs
Annual reports are a goldmine of facts, figures, stories and analysis. They give a unique window into the inner workings of an organisation, explain how money is raised and spent, celebrate achievements, and set out the goals for the next year.
At a time when UK charities have a public image problem – just 38% of people think the sector is trustworthy, (2016 YouGov) and only a third believe it is transparent, (2015 IPSOS Mori) – the days of weighty PDF documents, albeit well designed ones, lingering on the ‘About Us’ sections of websites are over. If organisations are serious about opening themselves up to public scrutiny engaging digital reports are crucial. Making reports digital isn’t just about transparency – fundraising is increasingly reliant on a perception that money is being spent well.
1. Warby Parker
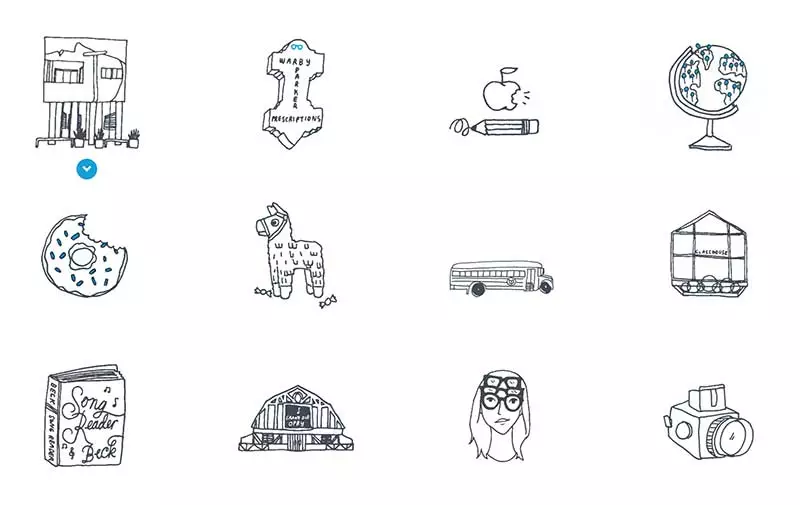
Glasses designer Warby Parker is renowned for interesting, fun and infinitely sharable annual reports. The result? Bumper sales and viral social media chatter.
2. Thankyou
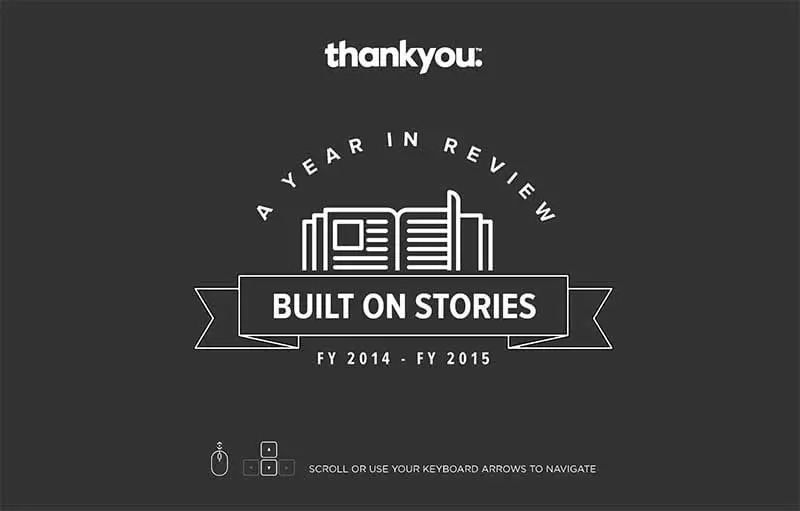
Social impact organisation Thankyou use their very well designed annual report to celebrate the years achievements. The single page scroll and clean graphics tell the story of impact and uses that to reach new audiences.
Advertisement
![[ad] The Great Fundraising Masterclass, Revolutionise. Dublin and London, September 2026](https://fundraising.co.uk/wp-content/uploads/2026/07/GFM-Series-26-UKF.png.webp)
3. Christian Aid UK
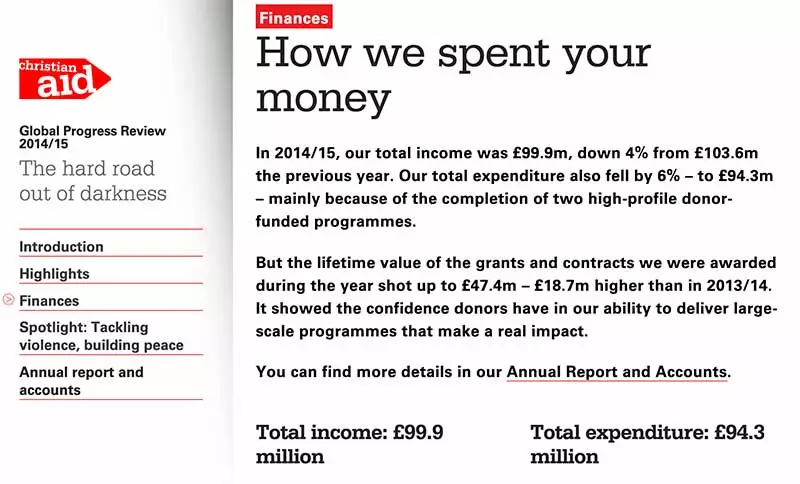
Christian Aid UK’s Global Progress Review accompanies their annual report. It is a well constructed, savvy piece of digital content that epitomises how a digital report can reinforce organisational transparency. The map breakdown of spending by country is clear. As a journalist I really notice that every picture has a proper photo credit. The use of high quality video is nice too.
What Christian Aid have understood is that people want highlights, they don’t want to trudge through a 90 page PDF, by curating their report they give it public value.
4. Save the Children UK
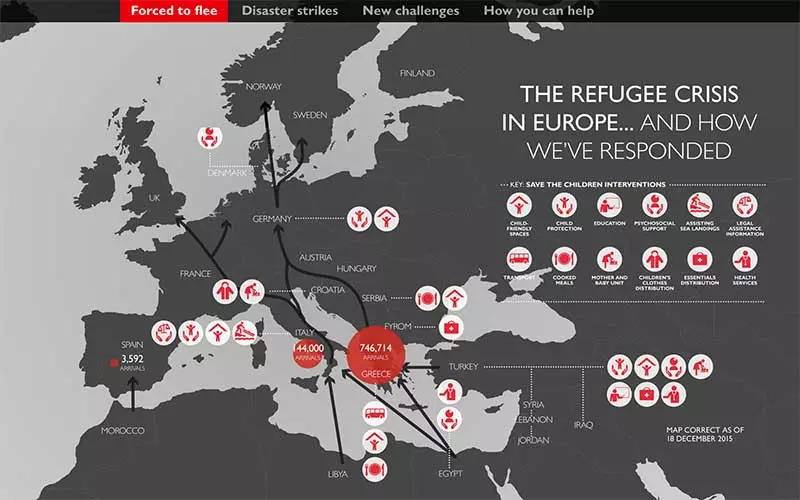
Save The Children’s 2015 report on impact is a fantastic example of using digital long-form to explain precisely why donations are needed and what money is being spent on. By embracing clear cut narrative instead of an emotive appeal SCF demonstrates how digital reports can be fundraising tools.
5. Mind UK
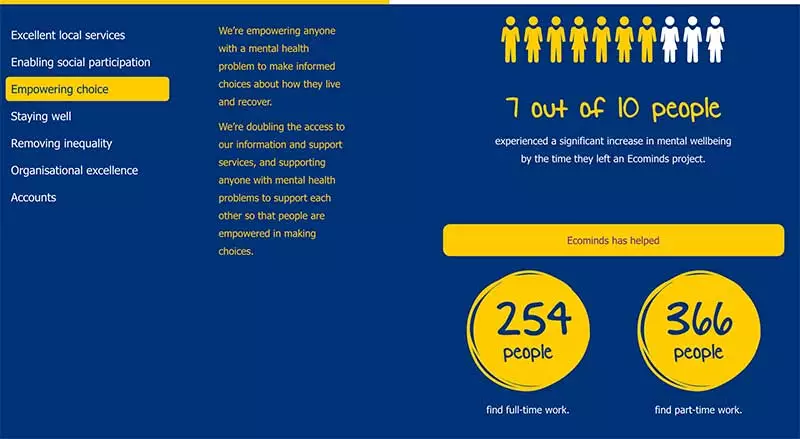
Mental health charity Mind UK’s 2013 digital report continues to be an outstanding example of what organisations can do with their facts and figures. With graphics that change as you scroll and animated drawings the annual review maximises the numbers. The job of a report is to engender confidence, Mind makes excellent use of simple digital technology to set out why it needs to exist and how it is helping people.
6. Krochet Kids
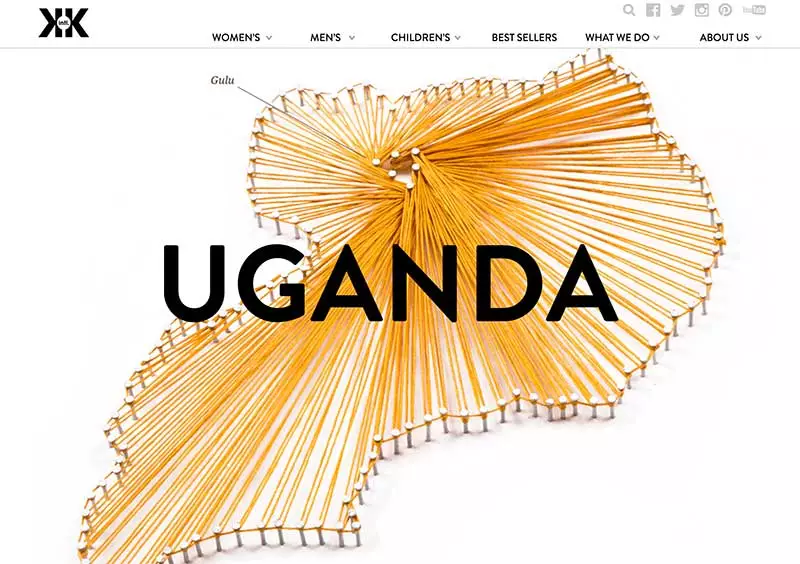
US-based Krochet Kids’s 2013 Annual Report was one of few that use interactive tech.
The clickable spider chart lets you track the progress of the women that Krochet Kids help through the year.
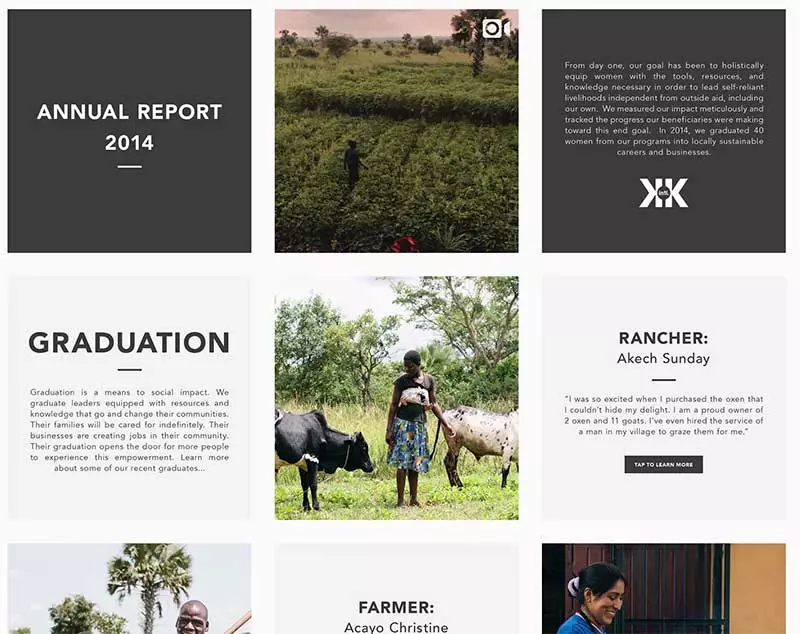
In 2014 Krochet Kids went further and published their Annual Report in 45 different Instagram posts. While I’m not sure how many ‘grammars actually click through that many posts, it is a clear statement of bringing your report to your audience.
A well done digital annual report tells people everything they need to know about your organisation without burying them in content. The avenues for storytelling and data visualisation open up annual reports to a whole new audience, they become tools in a charity arsenal to be used for marketing and fundraising purposes.
Zoe Tipler is the Founder of Muddle Up, a creative studio that specialises in turning annual reports into immersive digital experiences.
![]()
Related posts
BBCon Day 1 highlight: an awesome example of data integration and personalisation from Boston Children’s Hospital
Reporting from CFG London Members' Meeting: Social Media and Fundraising sessions

Slow-mo for Mo Bros – new app for Movember
Apple Pay for web – what does it mean for your charity?
About Howard Lake
Howard Lake is consultant editor of UK Fundraising. He founded the site in 1994 and successfully sold it in 2022. As director of Giving X Ltd he is exploring growing giving on a massive scale.
He is the founder of Fundraising Camp and co-founder of GoodJobs.