
14 fundraising research reports and tools for April 2016

Howard Lake | 30 April 2016 | News
Here is our latest roundup of fundraising statistics, research and research tools for fundraisers.
1. Top 100 UK charities 2016
This list is produced by Civil Society News in partnership with Charity Finance magazine. “It ranks the UK’s biggest charities by their average total income over the last three years. It excludes charities which are government-controlled”.
Advertisement
The three-year average helps remove the occasional income anomalies caused by large or a number of legacies, capital campaigns, major grants or corporate partnerships.
The top seven charities remain unchanged in their position from last year.
Significantly, the minimum total average income for this year was £57 million, an increase of 10% on last year’s minimum. In addition, last year’s minimum income rise was just 3%, suggesting that the largest charities have together raised substantially more than they did in the previous year.
2. YouGov profiles
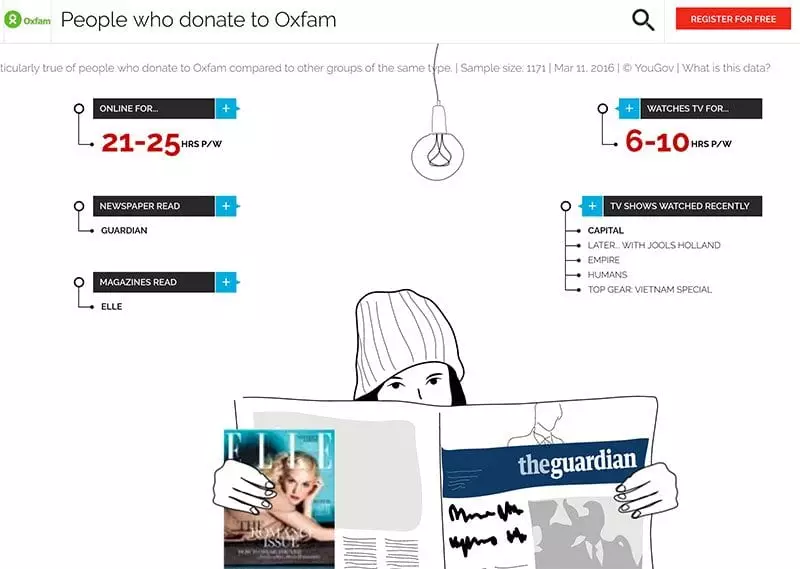
What kind of people support your charity, and who supports charities like yours? Do your charity’s supporters resemble the consumers of a particular company or retailer?
You can explore these questions via YouGov Profiles LITE, a free version (upon registration) of the research company’s segmentation and profiling tool for brands and agencies.
If you pay for the full version then you get access to “over 120,000 different data points on a group of over 250,000 YouGov Panel members”.
In the words of YouGov, “this app lets you search for a thing and find out about the customer- or fan- base of that thing”.
3. Up to date social media channel users
Who in the UK is on Facebook? How many Twitter users are there in the UK? How many of them access these channels on mobile devices?
Let’s start with some global statistics reported in March 2016 with Social Media Cheat Sheet for Users and Brands from Larry Alton on Digital Information World.
For UK specific statistics you’ll need to explore the country profiles section within WeAreSocial.com’s January 2016 report ‘Digital in 2016‘. You can find them starting on page 481 in the Slideshare summary below:
4. The power of saying thank you
The Behavioural Insights Team has reported on three studies into the impact of saying ‘thank you’.
A study of teacher motivation in Somerset found that a simple thank you email achieved the highest click-through. Teachers were emailed details of a professional resource to access together with four variants of a thank you, which achieved the following click-throughs:
- thanked (3.8%);
- thanked with a request to write a reflection on their teaching experience to pass onto new teachers (0.8%);
- thanked with a message a former student telling teachers about the amazing impact they can have (1.7%);
- thanked with a message from a newly qualified teacher sharing her excitement at joining the profession (2.8%).
On this occasion, the simple thank you was the most effective.
5. The power of saying thank you in person
The Behavioural Insights Team also reported on a 2006 study by Adam Grant and his team at the Department of Psychology at the University of Michigan (Impact and the art of motivation maintenance: The effects of contact with beneficiaries on persistence behavior) which found that “university call centre fundraisers raised 171% more money when they briefly interacted with a scholarship student”.
This increase was attributed to the fact that callers received a chance to see the impact of their efforts, and that the scholarship recipient received the chance to say thank you face to face.
6. Digital marketers want consumer data, but consumers don’t want to give theirs
How can fundraisers and marketers get better at using individuals’ personal data and sending only more and more personalised data? It looks like this could be quite a challenge because many people don’t want to give away any data, even in exchange for better services.
In a January 2016 survey mobile marketing company Tune found that 55% of smartphone owners in the UK and the US believed that advertisers should not be allowed to collect any data about them at all. A further 26% thought only very limited amounts should be collected.
7. Explore examples of direct mail via the Royal Mail

The Royal Mail’s Infobank is a free resource that helps you discover and understand your own customers (and donors) better.
Based at Royal Mail Media Centre in Holborn in London, it is a resource centre for advertisers, media buyers and agencies for their direct mail needs.
You can use it to target your next campaign, compare your competitors’ marketing activities, and review other organisations’ marketing campaigns and messages.
You need to book an induction visit first. After that you can visit Infobank at any time between 9am and 6pm, Monday to Friday.
8. TV ad break opportunity for UK multiscreen users
Individuals are not just using another mobile device screen while watching TV, they are increasingly turning to their mobile device during TV ad breaks.
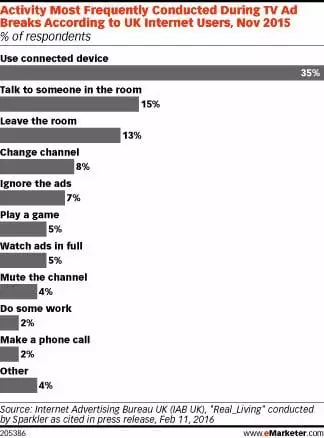
According to eMarketer, accessing a connected device is the most popular activity during an ad break for those surveyed. At 35% it is far ahead of “talking to someone in the room” at 15%. And the traditional “go and make a cup of tea” doesn’t even make it onto the list.
Perhaps that makes the TV ad breaks a good time to send your charity’s tweets?
9. Donors like it short and sweet, or so they say
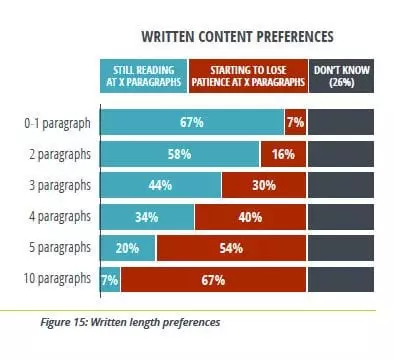
In Brevity is Best with Donors DonorRelationsGuru reports on a study by Abila that finds that donors want charities to stop overwhelming them with long text communications.
The study looked at the length of communications and videos, and asked donors when they were likely to stop reading a fundraising or other communication from a charity. The results were measured in paragraphs rather than pages! For example
- by paragraph two donors 58% of donors said they would still be reading
- but by paragraph three this was down to 44%.
For videos, the equivalent figures were:
- by minute two 56% of donors said they would still be viewing
- but by minute three that was down to 46%
Of course, direct mail fundraising has often demonstrated that multi-page letters outperform shorter ones. We are reminded of this in the comments and discussion below the blog post, not least by Pareto Fundraising’s Sean Triner, who also points out that donors don’t always do what they tell researchers they will.
10. Why people give money to charity
Michael Sanders and Francesca Tammer from The Behavioural Insights Team have both published a summary of research that can help fundraisers make their messaging more effective.
In The science behind why people give money to charity in The Guardian they cover:
- how professional will-writers can boost the chances of a charitable legacy simply by suggesting a gift to the individual
- how donors are more likely to respond with a donation if they are being asked to support an identifiable individual rather than a larger group
- why advertising a charity’s proven effectiveness does not boost giving
- how the level of an individual’s giving to a university telephone fundraising appeal can be increased if the caller is a former roommate
- how framing donation amounts can increase or reduce subsequent donations – donors on JustGiving are influenced by the amounts given by donors before them on donation pages
- match funding from a known and respected donor can boost giving compared to an anonymous donor, in the case of an overseas aid charity and the Bill and Melinda Gates Foundation
- how the chances of giving can be boosted if one sees other people giving, according to a Harvard University study. In other words, giving can be contagious!
- how spending money on other people can make us happier than if we were to spend it on ourselves
- how giving to others can have a positive impact on our health
11. Measuring long-form content
By contrast with the study above on donors’ apparent preference for brevity, James Higgott at The King’s Fund explains how he has measured how audiences interact with long-form content online.
In Long-form metrics: what to measure and how to measure it on WonkComms he sets out the key questions one should ask and then explains how or how far one can answer them.
For example, how far down the page do they read? Do they prefer HTML to PDF for long documents? Do they interact with images, videos or galleries? Which elements of content did they share? Does their behaviour change depending on which kind of device they are using?
12. Shouting loud on social media doesn’t always indicate a donor
In a revival of the ‘slacktivism’ issue, research at Johns Hopkins University Carey Business School has found that charities’ campaigns on social media can draw the attention of social media users but not always their commitment to donate money.
The paper Viral Altruism? Charitable Giving and Social Contagion in Online Networks was published in Sociological Science.
13. Trends in philanthropic support for UK higher education
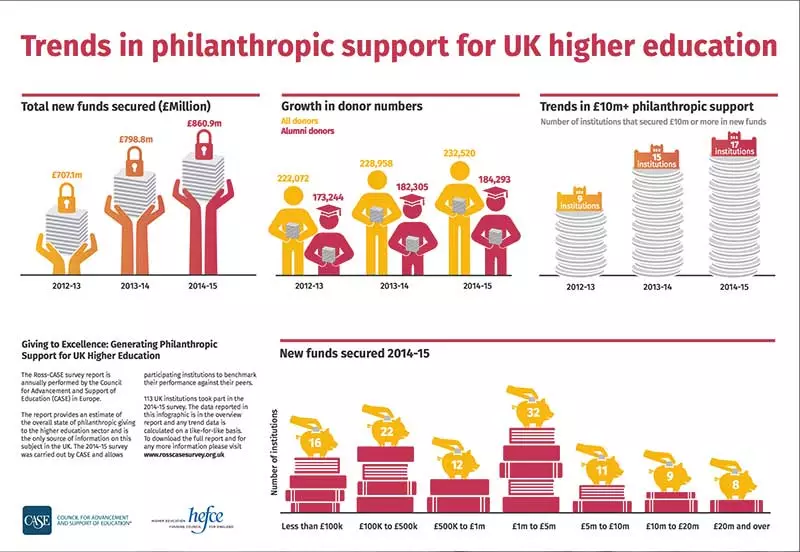
Giving to Excellence: Generating Philanthropic Support for UK Higher Education (the 2016 Ross-CASE Report) was published on 26 April 2016.
The report details rises total increases across the sector in new funds secured, numbers of donors, numbers of alumni donors, and the numbers of universities securing at least £10m in new funds.
113 UK institutions took part in the 2014-15 survey.
You can download the 2016 Ross-CASE Report in PDF.
14. Online fundraising in China
The China Association of Fundraising Professionals has produced its first report on digital fundraising in China. The 40-page document, Online Fundraising in China A Research Report on Third Party Platforms in 2014, which cites UK Fundraising in its references, looks at:
- third party fundraising platforms (giving sites, crowdfunding sites, charity shops)
- who gives online (age, gender, location), to which charities, and in response to which kind of message
- case studies (mobile, crowdfunding, P2P, monthly giving)
The report traces the origins of online fundraising in China to 2005, which was when “2 Non-profit Organizations found their ways to Taobao E-shops that drew the curtain of China’s performance of third party online fundraising platforms”. Currently the sector is dominated by Sina Gongy platform, but the sector has seen other entrants and is growing.
Related posts

![]()
About Howard Lake
Howard Lake is consultant editor of UK Fundraising. He founded the site in 1994 and successfully sold it in 2022. As director of Giving X Ltd he is exploring growing giving on a massive scale.
He is the founder of Fundraising Camp and co-founder of GoodJobs.